
How many responses does your survey really need?
It is one of the first questions most associations ask us when we are planning a member survey, particularly as survey responses get harder to attract.
How many responses do we need for the results to be credible?
It is a fair question. Boards want confidence in the numbers. CEOs want findings that will stand up. Membership teams want to avoid running a survey, only to find the sample is too small to support the decisions being made. But the answer often surprises people. The number of responses you need has far less to do with the size of your membership than most people expect. It has much more to do with what you want to do with the results.

Response rate is not the main target
In survey research, accuracy is driven mainly by the number of responses collected, not the proportion of the membership that responds.
A survey of 400 members is broadly as accurate for an association with 50,000 members as it is for one with 2,000. That can feel counterintuitive, particularly for larger associations that assume they need thousands of responses before the results can be taken seriously.
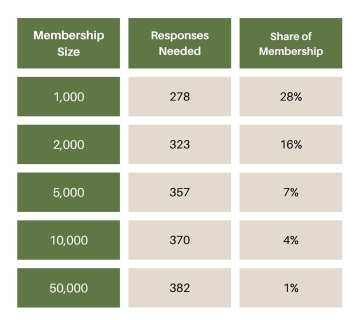
See the table below. To achieve a margin of error of approximately plus or minus 5 per cent at 95 per cent confidence, a 50,000 member association needs only 59 more responses than a 2,000 member association to reach the same level of precision. Bigger membership does not automatically mean a much bigger sample is required.
The real question is how the results will be used
The more important question is not how many members you have. It is how you intend to break the results down.
Most associations do not just need a single headline figure. They want to understand how views differ by member category, tenure, location, organisation size, career stage, accreditation status or engagement level.
That is where sample size becomes important.
A total sample of 400 may be enough for a strong overall result, but it may not support detailed comparisons across every subgroup. If a board wants results across six member categories, each category needs enough responses to support the way the results will be used.
This does not mean smaller sub-groups should be ignored. In association research, it is common to report on groups with fewer than 100 responses, and sometimes closer to 30. These results can still be valuable, particularly when they highlight patterns, raise questions or give voice to smaller parts of the membership.
The important point is how they are framed. A group of 30 responses should not be treated in the same way as a group of 300. It may provide useful directional insight, but it should not be used for over-confident conclusions or fine comparisons. Where base sizes are small, reporting should make that clear and interpret the findings carefully.
Precision has a cost
Associations will sometimes ask for a tighter margin of error, for example, plus or minus 3 per cent instead of 5 per cent. However, as everyone knows, it is getting harder to get members to respond. And so while on paper tighter sounds better, in practice it can be expensive.
For a 5,000 member association, moving from a 5 per cent margin of error to a 3 per cent margin of error increases the required sample from around 357 responses to around 880. That is a large increase in fieldwork for a relatively small increase in precision.
There are projects where that level of precision is justified, particularly where the results will inform major investment, public advocacy or high-stakes policy positions. But for many member surveys, the extra fieldwork does not materially change the decisions being made.
Representativeness matters more than size
Sample size is the question people tend to ask first, however, representativeness is often the more important issue.
A large sample that over-represents your most engaged members can be less useful than a smaller sample that better reflects the membership as a whole. This matters in member research because the people who respond quickly are often those already most connected to the association. The members drifting towards non-renewal are usually harder to reach, yet they are often the members whose views matter most.
That is why it is important to profile respondents against membership records, where possible. Category, tenure, location, age band, membership type and engagement level can all help show whether the survey is reflecting the membership properly. We employ weighting to correct imbalances in the sample where it is necessary.
Start with the decision, not the target number
The most useful preparation before commissioning member research is not choosing a target number of responses. It is deciding which decisions the research needs to support.
Do you need a reliable overall measure of member satisfaction? Do you need to compare member categories? Do you need evidence for advocacy? Do you need to understand renewal risk? Do you need to track whether a strategic initiative is making a measurable difference?
Each of those questions has different implications for sample size, fieldwork design and reporting. The credibility of a member survey does not come from having the biggest possible sample. It comes from having the right sample for the decisions you need to make.
If you need help to work out the most appropriate sample size for your next project, please feel free to get in touch.
All figures in this article are calculated at 95 per cent confidence, using a 50/50 response split as the conservative case, with finite population correction applied where a membership size is stated.